
Characteristic curves play an important role in various fields (e.g. electrical engineering, control engineering [e.g. valves], etc.).
A new CNS class (CNS_CHARACTERISTICS_GRAPH ) has been introduced for classifying characteristic curves. A characteristic curve can be described using the associated features.
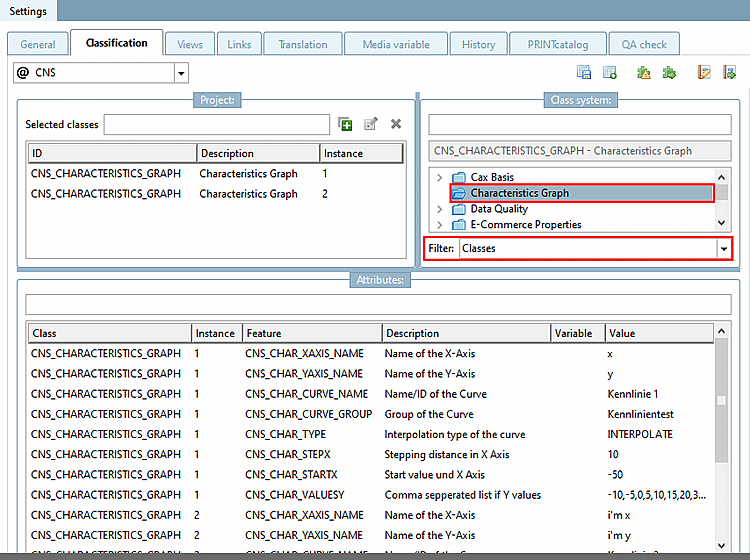
Following figure exemplarily shows the class with attributes and two instances. The attributes can be manually filled; however, normally the are imported in automated processes (e.g. from VDI Excel data).
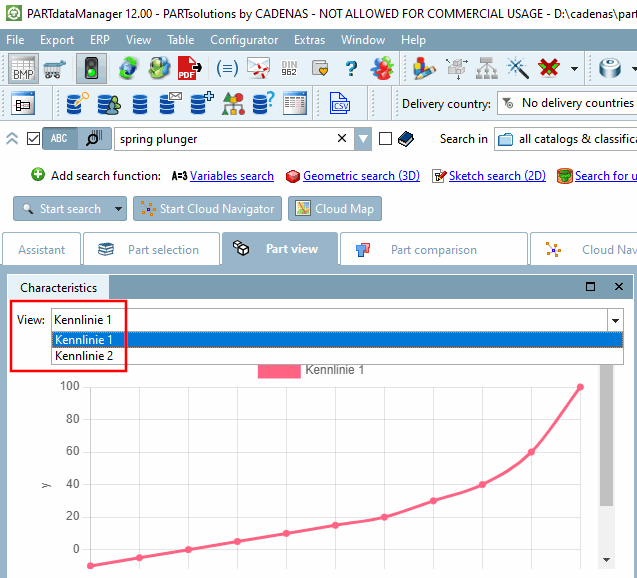
If the corresponding classification data is available, the existing characteristic curves (in example 2) are displayed in PARTdataManager (or other platforms) are displayed in a separate docking window.
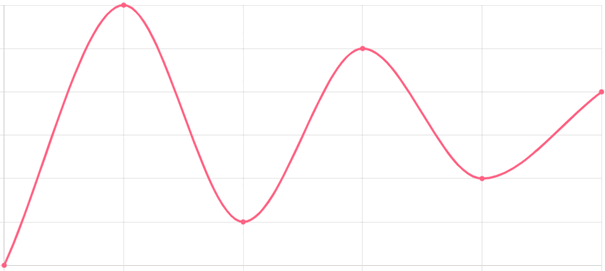
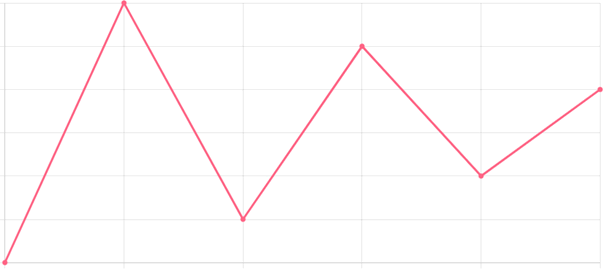
Following figure clarifies the relation between depiction and individual attributes in color.
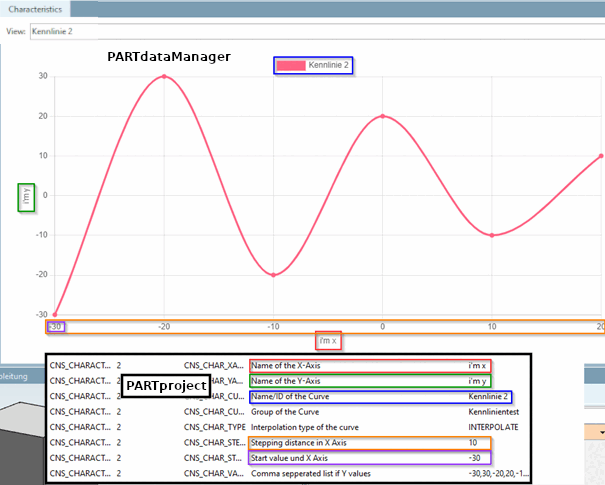
Y-values are inserted in the respective attribute separated by comma from left to right. Then the curve is automatically generated, beginning at the specified starting point and progressing with the specified step width.
![[Note]](https://webapi.partcommunity.com/service/help/latest/pages/cn/partsolutions_admin/doc/images/note.png)