Use the history analyzer to create a report that seamlessly records and analyzes the creation process of an entire catalog.
|
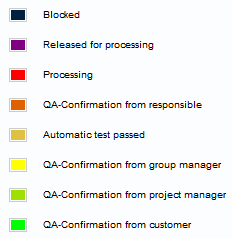
The QA status level of each directory or project is used, for example, to illustrate who was responsible at what time. |
|
Optionally export the report as PDF, HTML page, CSV or ZIP file.
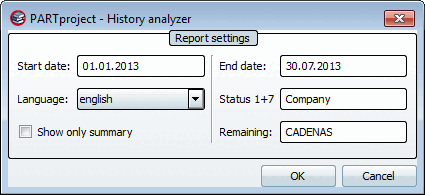
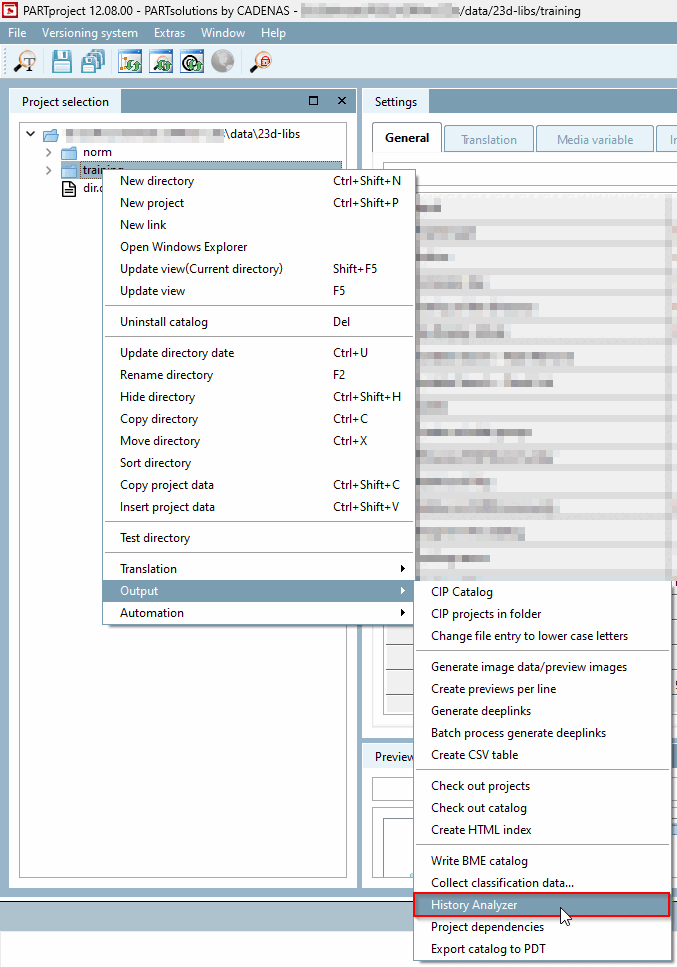
Call up the history analyzer. You will find the command in PARTproject at every catalog level (catalog itself, any directories, project).
Determine timeframe, language, and status level(s) to be evaluated.
Per default a starting date of the project is set and for the end date the current date is set. You can limit the range at any time in order to get special analyzes.
The report language can be chosen independent from the current user interface language. Select your preferred language in the list field.
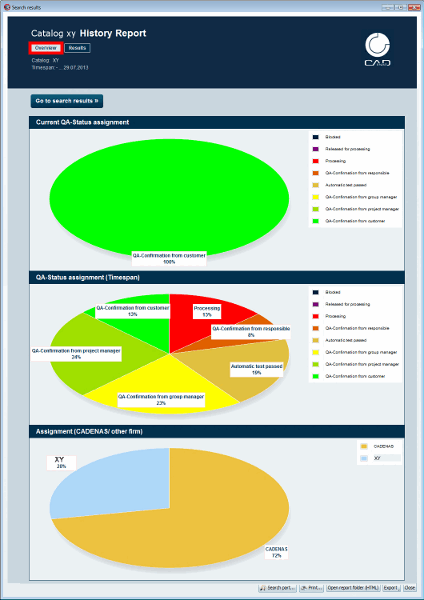
You will only receive the evaluation in the form of the "pie charts" shown below. The individual evaluation of all projects is omitted.
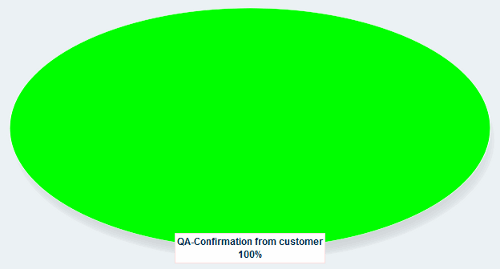
Current QA status distribution [Current QA-Status assignment] (snapshot )
The diagram shows how many percent of the projects are in the respective status at the current point of time.
A finished catalog for example shows everything in green = status 8 or possibly a smaller part with lower status in addition, if new projects are already in work.
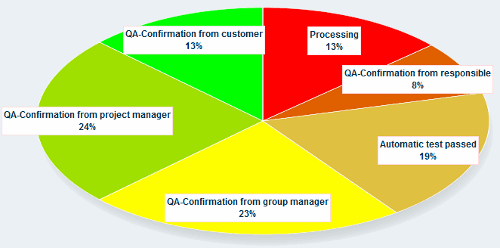
QA status distribution (period) [QA-Status assignment (timeframe)]:
The diagram shows the percentage of processing times in the individual statuses over the defined project duration.
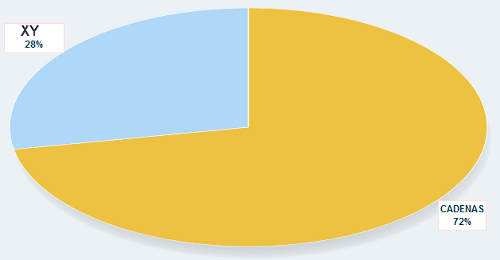
Division (CADENAS [Assignment (CADENAS/ other firm)] / other company) [Assignment (CADENAS/ other firm)]:
The diagram shows the percentage of working time between customer and CADENAS, thus giving a review of whether the project process is efficient.
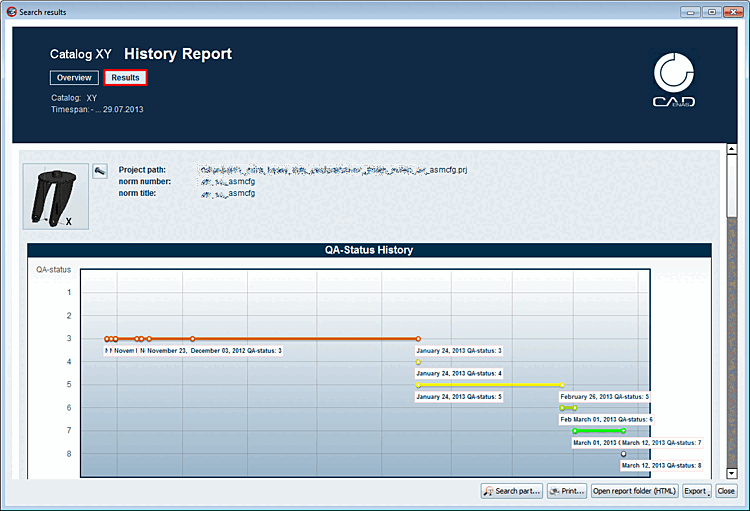
Open the report in the Results category.
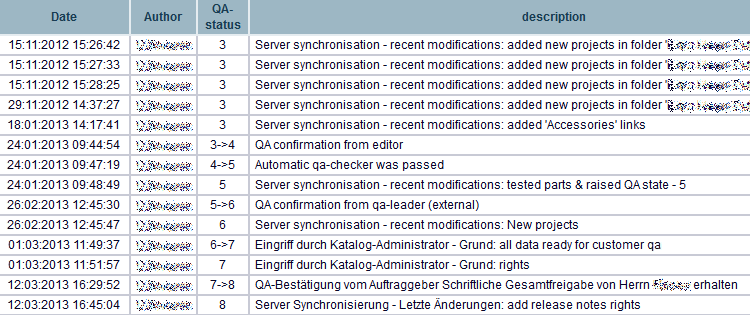
When and which status change was made is recorded on the time axis for every project.
Below each project you will see the link Clicking on the link also displays the history of changes in tabular form.
![[Tip]](https://webapi.partcommunity.com/service/help/latest/pages/cn/partsolutions_user/doc/images/tip.png)